WESA-Campos Survey: Summer in Pittsburgh
Campos and 90.5 WESA, Pittsburgh’s NPR News Station, are partnering on a series of short opinion surveys of adults in the Pittsburgh region to better understand their opinions on a range of timely topics. This joint research and reporting project will ensure WESA can tap into the opinions of people in Pittsburgh on a regular basis and use the corresponding results to complement its reporting. (For more information, or to sign up to participate, click here.)
In the second round of the WESA/Campos Pulse Survey, we investigated Pittsburgh residents’ habits and preferences regarding leisure and recreation, with a particular focus on summer fun and where people are going (and not going) in the city these days.
Key Findings
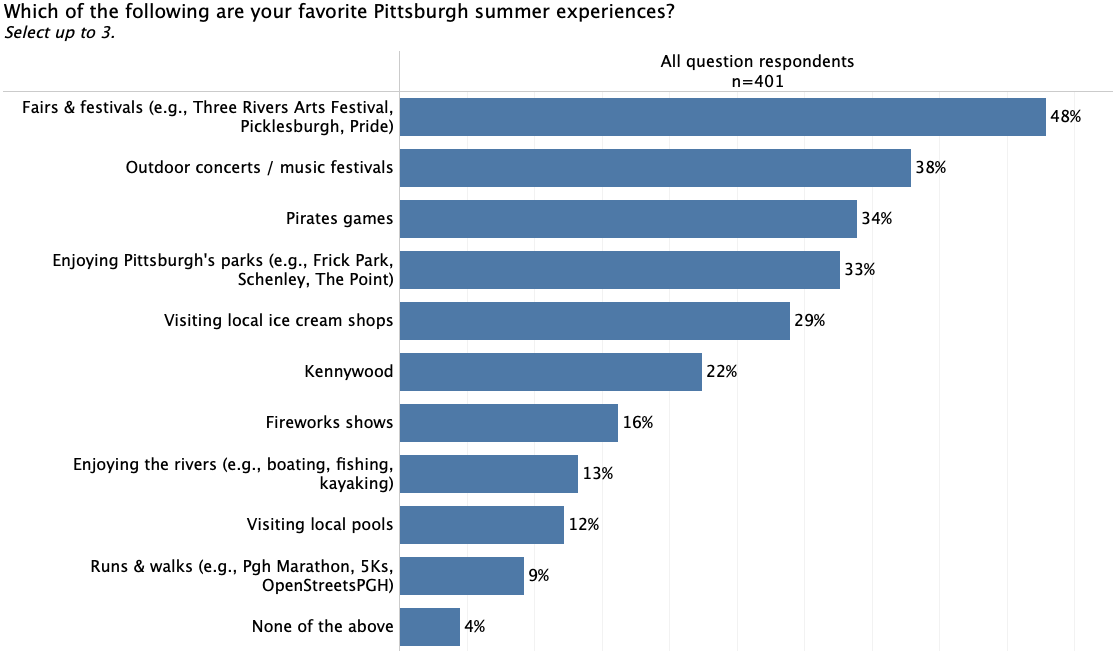
By popular choice, festivals/fairs and outdoor concerts are the most-loved things to do in Pittsburgh in the summer.
Percentages below indicate the percent of respondents who selected that experience as one of their top 3 favorite Pittsburgh summer experiences.
In aggregate, Pittsburgh area residents’ favorite summer experiences (from the list provided) are:
#1 - Fairs & festivals
#2 - Outdoor concerts / music festivals
#3 - Pirates games
#4 - Enjoying Pittsburgh’s parks
#5 - Visiting local ice cream shops
Among those who live within the City of Pittsburgh, however, enjoying Pittsburgh’s parks is tied with fairs & festivals for the top summer experience (48% for each).
Pirates games and Kennywood are notably less popular among the city-dwellers as opposed to other respondents.
On balance, Pittsburgh area residents have not substantially changed the amount that they go Downtown for fun & recreation, compared to before the Covid-19 pandemic.
Those who do not go out to/within the City of Pittsburgh for fun or recreation at least once a year (7% of the sample) were not shown this question.
Out of the seven locations asked about in the survey, Downtown had the greatest volatility in visitation—meaning, the greatest churn in visitation rates, either positive or negative. Only 39% of respondents have not changed the amount of time they spend downtown for fun/recreation.
Slightly more respondents said they were spending more time Downtown now (33%) than said they were spending less time there (28%). However, this 5% difference is “directional” only, not statistically significant.
Younger respondents (18-34 years old) are going Downtown for fun and recreation more than they were before Covid-19, on balance. 41% say they are now going there more often, vs. 21% going there less often—a statistically significant difference.
However, among young respondents, a similar positive difference is seen for nearly every location we asked about. This suggests that the difference is due to young people going out more often in general now, compared to before the pandemic.
Directionally, those who live outside of Allegheny County tend to be going to Downtown less now than they did before Covid-19. (Those who live inside the County, including those in the City of Pittsburgh, show no change, on balance.)
Among those who are going Downtown less than they used to, concerns about crime and homelessness in the area are the most prevalent reasons why.
Respondents were only shown this question if they indicated that they are going Downtown less for fun and recreation now, compared to before the Covid-19 pandemic. (n=103)
Of those who said they’re going Downtown less now, 65% said that “crime in the area” is a reason and 58% said that “homelessness in the area” is a reason, making these the two most common reasons, by far.
38% also cited a decline in retail options, and 32% cited a decline in restaurant options.
Pittsburgh area residents (on balance) are going more frequently to the Strip District and the North Shore / North Side for fun and recreation compared to before the pandemic—and less frequently to the South Side.
Those who do not go out to/within the City of Pittsburgh for fun or recreation at least once a year were not shown this question.
The Strip District and the North Shore/North Side had almost equal positive shifts in visitation rates, with 38% and 35% of respondents having increasing their visitation to these locations, respectively.
Only 13% of respondents had decreased their visitation to either of these destinations.
The South Side saw nearly as large a negative shift in visitation rates overall, with 30% having decreased their visitation there and only 18% having increased it.
Changes in visitation differed by residence location:
Those who live in the City of Pittsburgh have most increased their visitation to The Strip District, Lawrenceville/Bloomfield, and Shadyside/Squirrel Hill.
Those who live outside the City of Pittsburgh limits (including in other counties) have most increased their visitation to the North Shore/North Side, the Strip District, and Downtown.
Younger respondents (18-34) were especially likely to have increased their visitation to any of the locations on the list. The only destination on the list that younger respondents had decreased their visitation to, on balance, was South Side.
Survey Methodology
Fielding dates: July 3-10, 2023
Survey length: 5-8 minutes
Sample: 401 adults (age 18+) in the Pittsburgh region
Responses were solicited from the proprietary Campos Research Panel (10,000+ members in the Greater Pittsburgh area). Respondents were offered a chance to win one of five $50 gift cards to incentivize participation.
About 83% of the respondents reside in Allegheny County, and about 17% reside in the adjacent 5 counties (Armstrong, Beaver, Butler, Washington, Westmoreland).
The sample was managed to be approximately representative of the 6-county region by age, gender, and race/ethnicity.
Screening Criteria:
Age is 18 or older
Resides in Allegheny, Armstrong, Beaver, Butler, Washington, or Westmoreland counties
About the WESA/Campos Pulse Survey: https://www.campos.com/wesa-campos-pulse


